Benchmarking Change Detection: Lessons from QFabric
Part 2 of 2 in the QFabric series. Previous: Building a Multi-Task Change Detection Dataset.
Experimental Setup
With QFabric in hand (see Part 1 for how we built it), we benchmarked several architectures across four distinct tasks: change detection, change type classification, change status tracking, and neighborhood classification.
We split the RGB dataset into training (70%), validation (20%), and test (10%) sets by randomly selecting entire cities—ensuring the model never sees the same city in both training and evaluation. Each 8192 x 8192 tile was divided into 512 x 512 patches using a sliding window.
Data augmentation included random 90-degree rotations, horizontal and vertical flips, up to 25% zoom, and linear brightness adjustments of up to 50%.
All networks were implemented in PyTorch and trained on a Kubernetes cluster with three nodes of eight V100 GPUs each, managed via Polyaxon for experiment tracking.
Task 1: Change Detection
The most fundamental task: given two or more images of the same location, identify where change occurred.
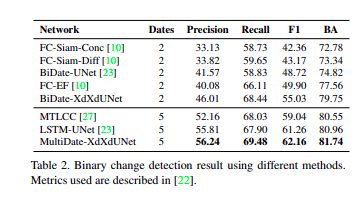
The key finding here is that multi-date approaches outperform bi-date baselines. When models can see intermediate dates between “before” and “after,” they become more robust to false positives caused by seasonal variations, cloud shadows, and lighting differences. This validates one of QFabric’s core design choices: five dates are better than two.
Task 2: Change Type Classification
Beyond detecting where change happened, this task asks what kind of change occurred—new construction, demolition, road modification, or other categories.
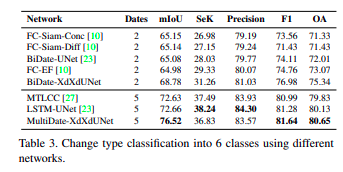
Change type classification proved significantly harder than binary change detection. The imbalance between categories (construction dominates the dataset, since most urban change involves building) means models struggle with rarer types like demolition. This suggests that class-weighted losses or oversampling strategies would be important for practical deployment.
Task 3: Change Status Tracking
This is QFabric’s most novel task: tracking the progression of change across five dates. For each change polygon, the model must predict the construction status at each time step (e.g., vacant → land cleared → foundation → under construction → completed).
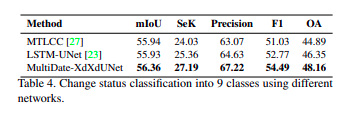
Sequential architectures that explicitly model temporal order (using recurrent or attention mechanisms across dates) outperform approaches that treat each date independently. This makes intuitive sense: construction follows a predictable progression, and models that can learn this temporal prior have an advantage.
However, even the best models struggle when construction timelines are irregular—for example, when a project stalls for months and then resumes. These edge cases represent an open challenge.
Task 4: Neighborhood Classification
This auxiliary task classifies the broader context of each change: is it happening in an urban, suburban, or rural area? Is the neighborhood residential, commercial, or industrial?
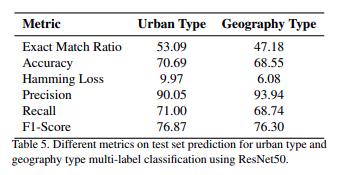
Neighborhood classification achieved the highest overall accuracy among all tasks, which is expected—the visual signatures of urban vs. rural areas are distinctive at 0.45 m resolution. This task serves as useful auxiliary supervision that can improve performance on the harder tasks when trained jointly.
Key Takeaways
- More dates help. Multi-temporal approaches consistently beat bi-temporal ones, especially for reducing false positives from seasonal and atmospheric variations.
- Change type is hard. Class imbalance is a real challenge when most urban change involves construction. Future work should explore class-balanced training strategies.
- Temporal order matters. For status tracking, architectures that respect the sequential nature of observations outperform those that don’t.
- Auxiliary tasks boost performance. Joint training with neighborhood classification as an auxiliary task can improve the primary change detection and classification tasks.
QFabric remains an active benchmark for the remote sensing community, and we continue to see new architectures evaluated on it. The paper is available through the CVPR 2021 EarthVision Workshop.
Part 2 of 2 in the QFabric series. Previous: Building a Multi-Task Change Detection Dataset.