Building a Multi-Task Change Detection Dataset
Part 1 of 2 in the QFabric series. Next: Benchmarking Change Detection: Lessons from QFabric.
Why Change Detection Needs Better Data
Detecting change through multi-image, multi-date remote sensing is essential for understanding global urban development. While deep learning has brought significant advances to remote sensing, novel methods for accurate multi-image change detection remain limited by data availability.
Most existing change detection datasets are bi-temporal: they provide just two images (a “before” and “after”) and ask models to find what changed. This simplification discards valuable information about how change unfolds over time. Did a building go up in one year or five? Was land cleared before construction began? These questions matter for urban planning, insurance, and environmental monitoring.
We set out to build QFabric, a multi-temporal, multi-task change detection dataset that captures not just whether something changed, but what kind of change occurred and what stage it reached across multiple observation dates.
What Existing Datasets Were Missing
Before QFabric, the main options were:
- OSCD: 24 Sentinel-2 image pairs from European cities, with only 1,769 change polygons across two dates.
- OSCD-Extension: Extended OSCD to five dates, but remained small in scale.
- LEVIR-CD: 637 Google Earth image pairs at 1024x1024 pixels, focusing on building change over 5–14 year spans.
- HRSCD: 291 aerial image pairs with pixel-level land cover annotations from Urban Atlas maps.
These datasets served binary change detection well, but none captured the type and status of change across an observation period. In real-world applications, knowing that a structure went from “land cleared” to “foundation laid” to “building complete” is far more actionable than a simple changed/unchanged label.
Building the Dataset
Location Selection
We selected 504 locations from 100 cities worldwide, maximizing geographic and urban diversity. For each location, we sampled satellite images from five different dates, spaced roughly equally over the observation period. We deliberately mixed months and seasons across dates to capture seasonal variation. Cloud cover was restricted to under 5% per image.
Image Processing
Each location covers an 8192 x 8192 pixel tile at 0.45 m ground sample distance—enough resolution to see individual buildings and construction stages. The raw imagery comes as 4-channel (RGB + near-infrared) multispectral data, pan-sharpened using a separate high-resolution panchromatic channel to double the native resolution. The 16-bit pixel intensities were truncated at 3,000 and rescaled to 8-bit range for practical use.
Annotation Pipeline
A team of 20 annotators worked in two phases:
- Phase 1 – Polygon delineation: Each annotator reviewed first and last date images for a location and drew polygons around all changed regions.
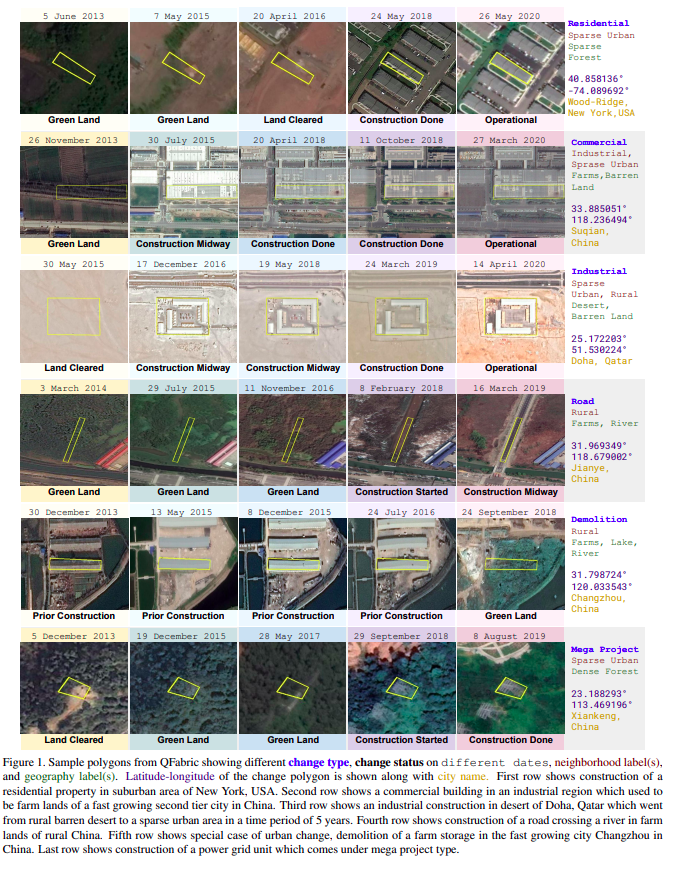
- Phase 2 – Multi-task labeling: Each polygon was then cropped with surrounding context from all five dates. Annotators labeled four properties:
- Change type (e.g., new construction, demolition, road change)
- Change status per date (e.g., land cleared, foundation, under construction, completed)
- Geographic type (e.g., urban, suburban, rural)
- Urban type (e.g., residential, commercial, industrial)
This two-phase approach ensured both spatial accuracy and rich temporal annotations.
Dataset Statistics
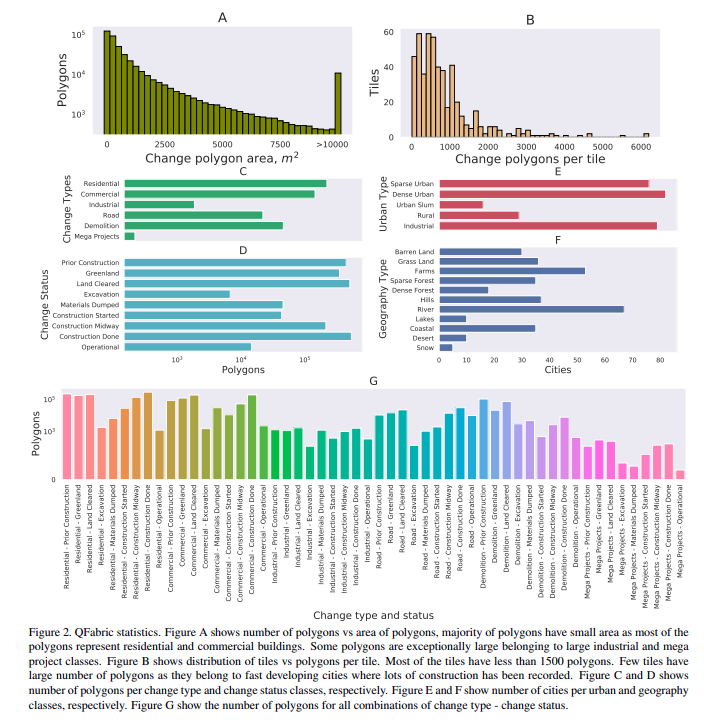
The final dataset contains thousands of annotated change polygons across 504 locations, each with five temporal snapshots and four annotation tasks. This makes QFabric one of the richest publicly available change detection datasets, enabling research on temporal change tracking that was previously impossible with bi-temporal datasets.
What This Enables
QFabric opens up several research directions beyond simple binary change detection:
- Change type classification: Distinguishing construction from demolition, road changes from vegetation changes.
- Change status tracking: Following the progression of a change event across multiple dates.
- Neighborhood classification: Categorizing the geographic and urban context surrounding changes.
- Temporal modeling: Developing architectures that exploit the sequential nature of multi-date observations rather than treating image pairs independently.
The dataset and paper are available through the CVPR 2021 EarthVision Workshop proceedings.
Part 1 of 2 in the QFabric series. Next: Benchmarking Change Detection: Lessons from QFabric.