Detecting Hail Damage on Rooftops
The Problem: Billions in Hail Damage Every Year
Hail storms cause billions of dollars in rooftop damage and insurance claims annually in the United States alone. Before a claim can be processed, an inspector must physically climb onto the roof to assess its condition—determining whether the roof needs repair or full replacement. This process is expensive, time-consuming, and dangerous, especially in the aftermath of severe storms when demand surges.
Drone imagery offers a safer and faster alternative. A drone can capture high-resolution images of a roof in minutes, but the bottleneck shifts from physical access to visual analysis: someone still needs to examine hundreds of images per property and identify individual hail strikes. This is where computer vision comes in.
What Hail Damage Looks Like
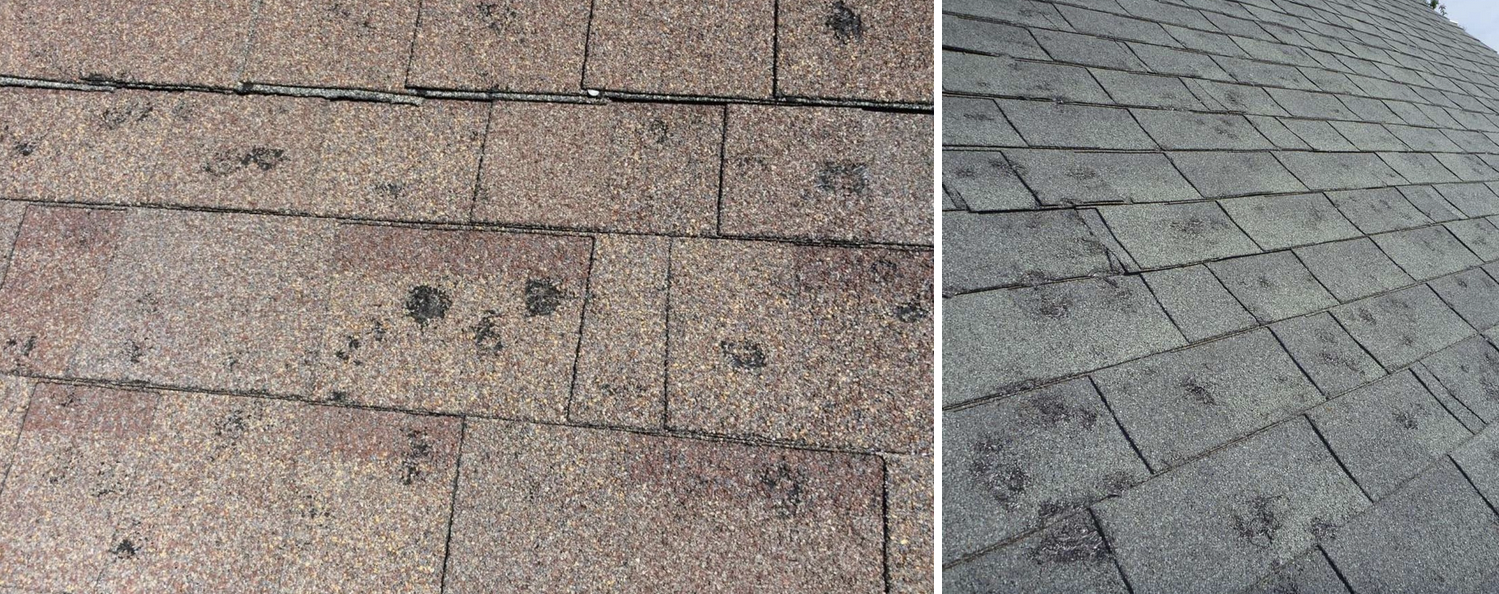
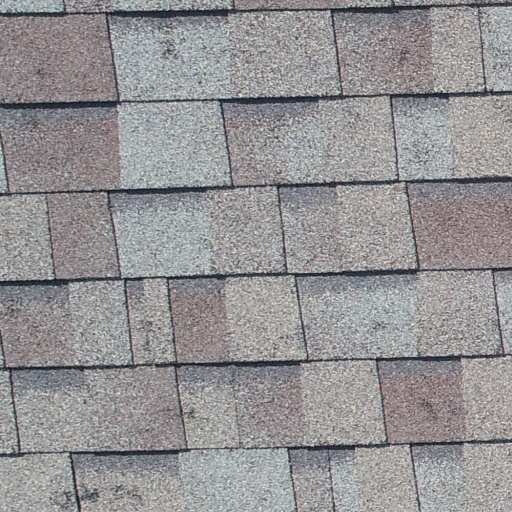
Hail impacts on asphalt shingles typically manifest as granule loss—the protective mineral coating gets knocked off, revealing the darker underlayment beneath. The resulting marks appear as roughly circular dark spots, ranging from a few millimeters to several centimeters in diameter depending on hail size and impact angle.
Other damage patterns include indentations, cracks, and exposed fiberglass mat, but the primary detection target is the characteristic dark bruise pattern. Critically, these marks can be subtle and must be distinguished from normal wear, debris (leaves and sticks), color variations in the shingles, and shadows.
Building the Dataset
We curated a dataset of 6,400 drone images containing 24,000 bounding box annotations of hail damage on residential rooftops. The images capture a range of shingle types, colors, and damage severities.
The annotation process involved marking individual hail strikes with bounding boxes. This granular annotation enables both detection (finding damaged areas) and counting (estimating the density of strikes per roof face), both of which matter for insurance assessment.
Data Quality Challenges
One of the biggest lessons from this project was the importance of annotation quality over quantity. Early analysis revealed significant issues:
- Over 40% of images had zero annotations (negative examples), far more than needed for training.
- Many annotations had not been validated by a second reviewer, and over 75% of unvalidated images contained errors.
- Annotation inconsistency was high—different annotators had different thresholds for what constitutes hail damage vs. normal wear.
These quality issues directly impacted model performance. Our data cleansing strategy focused on removing unvalidated images, limiting negative examples to ~5% of the dataset, and prioritizing validated annotations.
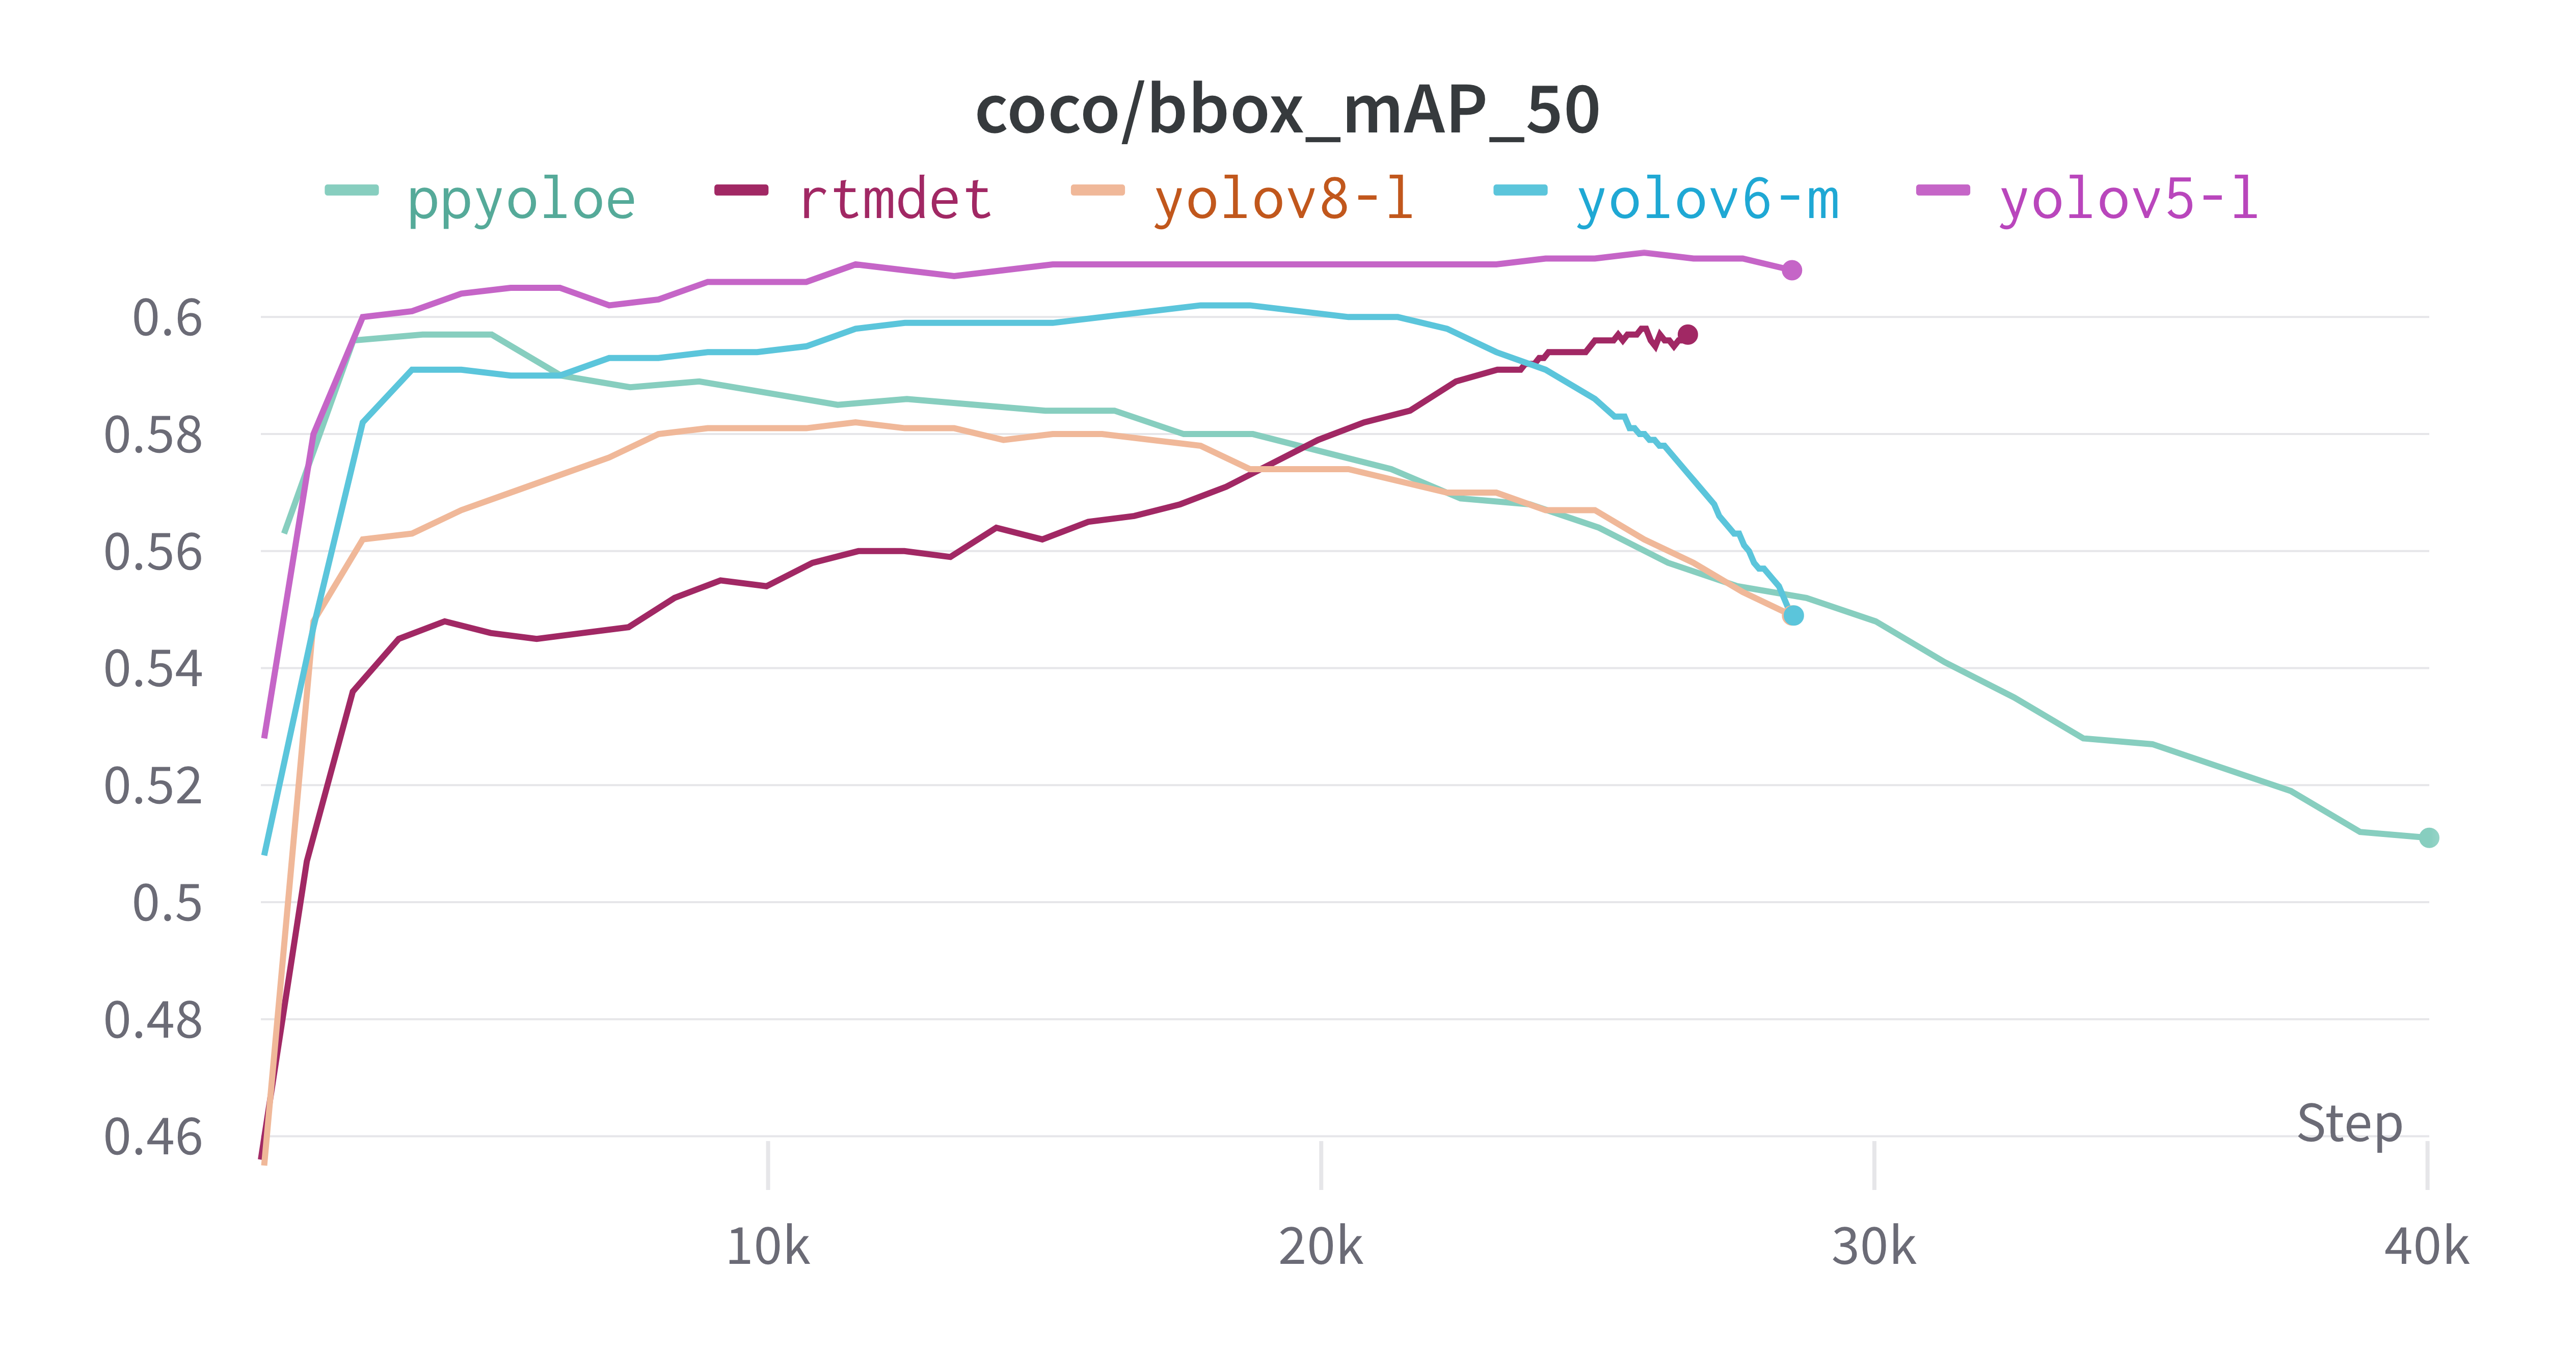
Model Selection: YOLO Family
We evaluated several object detection architectures, focusing on the YOLO family for its balance of speed and accuracy—important for a production system that needs to process dozens of images per inspection.
| Model | mAP@0.5 | Precision | Recall | F1 |
|---|---|---|---|---|
| Baseline (SOTA) | 0.406 | 0.705 | 0.464 | 0.56 |
| YOLOv5 (best) | 0.613 | 0.792 | 0.480 | 0.60 |
| YOLOv5 (high recall) | 0.599 | 0.723 | 0.590 | 0.65 |
| YOLOv8 | 0.545 | — | — | — |
| YOLOv6 | 0.554 | — | — | — |
| YOLOv3 | 0.558 | — | — | — |
YOLOv5 emerged as the best architecture for this task, achieving 0.613 mAP@0.5—a 50% improvement over the previous baseline. We found two operating points: a high-precision variant (0.792 precision) suitable for automated reporting, and a high-recall variant (0.590 recall) better for ensuring no damage is missed.
Attention-based detectors like DETR and Deformable-DETR underperformed the YOLO family on this task, likely because hail strikes are small, numerous, and visually similar—a setting where anchor-based detectors with strong spatial priors excel.
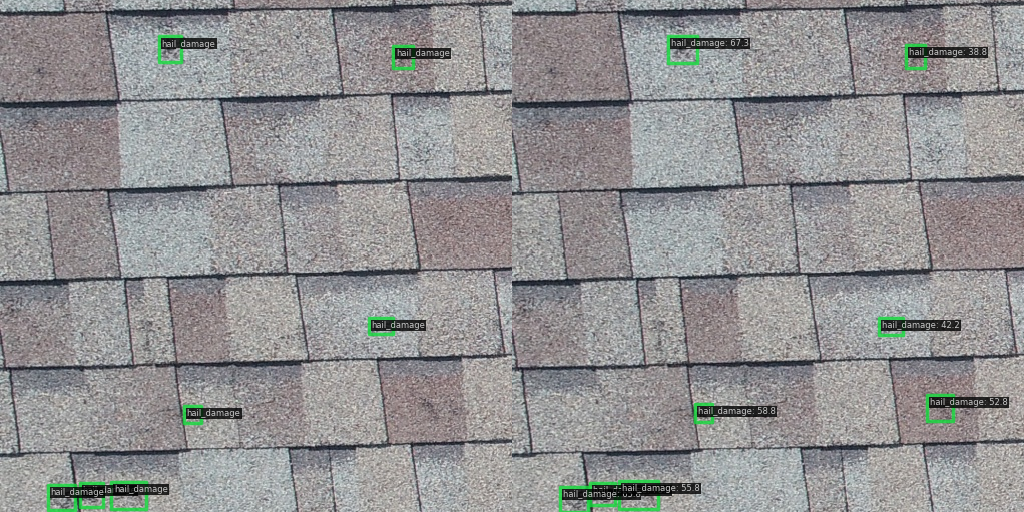
Visual Results
Beyond Detection: Damage Descriptors
Detection is just the first step. For insurance purposes, adjusters need to characterize the damage in more detail:
- Damage extent: How severe was each strike? Categories range from surface indentation to dark coloration, granule loss, and exposed/fractured fiberglass.
- Damage form: Is it a spherical impact (typical hail), a crack, or a nail pop?
- Damaged entity: Is the damage on a shingle or on a soft metal roof penetration (vent, flashing)?
We explored multi-label classification for these attributes, achieving early mAP scores of 0.28–0.41 across damage descriptors. While not yet production-ready, these results show the feasibility of automated damage characterization from drone imagery.
Lessons Learned
- Data quality trumps quantity. A clean dataset of 6K validated images outperforms a noisy dataset of 25K unvalidated ones.
- YOLO beats transformers for small object detection in dense, homogeneous scenes like roof surfaces.
- The precision-recall tradeoff matters for the use case. Insurance applications need high recall (don’t miss damage), while automated reporting needs high precision (don’t flag false positives).
- Damage characterization is feasible but requires more diverse training data to handle the long tail of damage types.